USE and RED methods: A Worked Example


Introduction
Quite often when something goes wrong with a system, we only know that something is happening, we rarely immediately know what the issue or its cause is, we therefore need to use certain methods for identifying the issue. In this blog post, I will be going over a few methods we can use to identify the causes of issues we face, and provide a real world worked example.
What are the USE and RED methods?
For identifying issues, we have 2 well established methods to use:
- The USE Method
- The RED Method
The USE Method
Standing for the Utilisation, Saturation and Errors method, introduced by Brendan Gregg and defined in his blog post here, is an infrastructure layer, service-centred method for analysing the performance of any given system, the USE method can be summarised as:
For every resource, check utilisation, saturation and errors.
Two parts make up the USE Method:
- 3 Metrics
- and a strategy
The 3 Metrics are:
- Utilisation: the average time that a given resource is doing some work
- Saturation: the degree to which the resource has extra work which it is not currently able to do.
- Errors: the count of errors reported by the resource.
The strategy is the use of a checklist which can be used to quickly identify resource bottlenecks and errors.
To do this we follow a workflow like:
- Identify resources
- Choose a resource
- Are there errors?
- Is there high utilisation?
- Is there saturation?
- If all resources are checked, and the issue is not identified, move to the next resource.
The RED Method
The RED method stands for Rate, Errors, Duration method, in comparison to the USE method, the RED method is aimed at the Service level and is primarily used on request-driven systems.
The RED method is about the workload that we are measuring, and will treat the service as a black-box.
The metrics used in the RED method are defined as:
- Rate: Rate of requests, e.g. Requests per second
- Errors: The count of errors coming from the workload.
- Duration: A mean distribution of request latency.
How do we use them?
As mentioned, the methods are focused on different layers, USE method being for the Infrastructure layer, and RED being for the Service or Application layer.
Using a layered architecture for example:
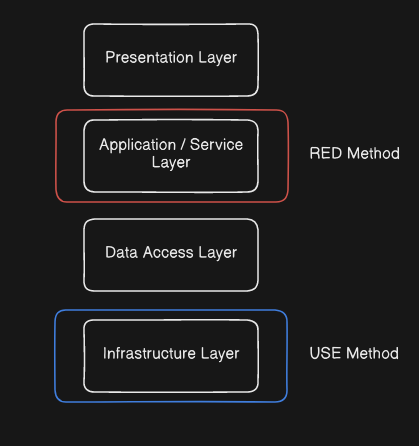
When we suspect an issue is occurring with our system, we can use the methods to narrow it down. For example, if users of your service are experiencing and reporting issues, you could start with the RED method and target the service they are reporting from, this may lead you to needing to analyse the underlying infrastructure for bottlenecks and errors, which you can then apply the USE method to.
A worked example
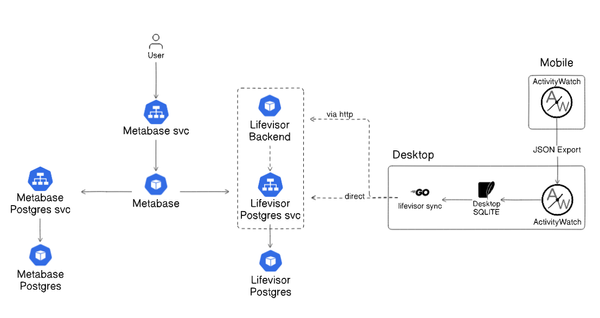
This is a real world example which I have faced recently, I won't be mentioning some specific details and will give services generic names, for background, this is an internal application used for ITSM at a large organisation, having millions of tickets stored in the database, the architecture of a single node in the system is as below:
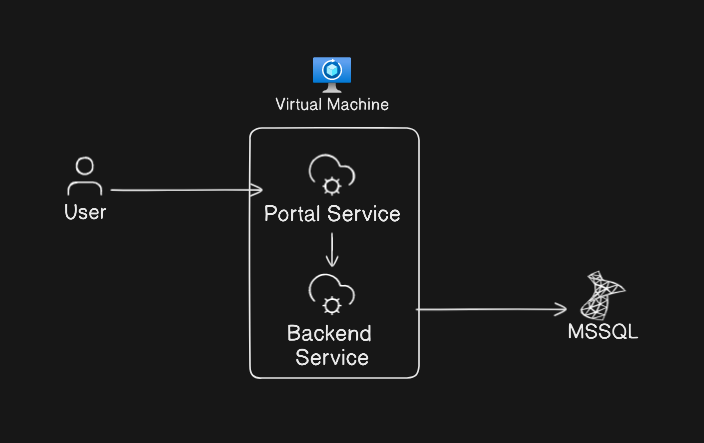
Definitions:
- Backend Service: A legacy application for handling various ITSM activities and workflows
- Portal Service: A third-party provided modern front-end bolted onto the legacy application to improve usability.
- MSSQL: Microsoft SQL Server, used for storing the data for to the backend service.
The Issue:
Intermittently users of the portal service would report that they are experiencing status 500 errors, indicating that the server process running the portal service had run into some issue.
So, where do we start? We know that users are directly being affected so lets start with the RED method:
- Rates: As this is an internal application, the service doesn't see a lot of traffic, checking the RPS at the time of the errors being reported, the rates were typical for the day at ~7 RPS.
- Errors: As we know from the reports, errors are being returned, so error rates have increased, and the status code for these errors during this increase are all
500. - Duration: Latency has increased for all requests, as they aren't being served properly by the server.
From the above, the most actionable are the errors, Error 500 indicates that something has gone wrong with the server, so our best bet is to check the server logs and see what we can see.
Server Logs
The logs indicate that the server experienced memory pressure and the process that was running the portal service had been killed and restarted, so we've had another clue: memory, a function within our portal service is causing memory pressure.
We now have a resource for us to look into for the USE method, so lets work through our USE method checklist:
- Choose a resource: Memory
- Are there errors? Not specifically at the infrastructure level
- Is there high utilisation? Lets our existing Grafana dashboard for monitoring infrastructure metrics:
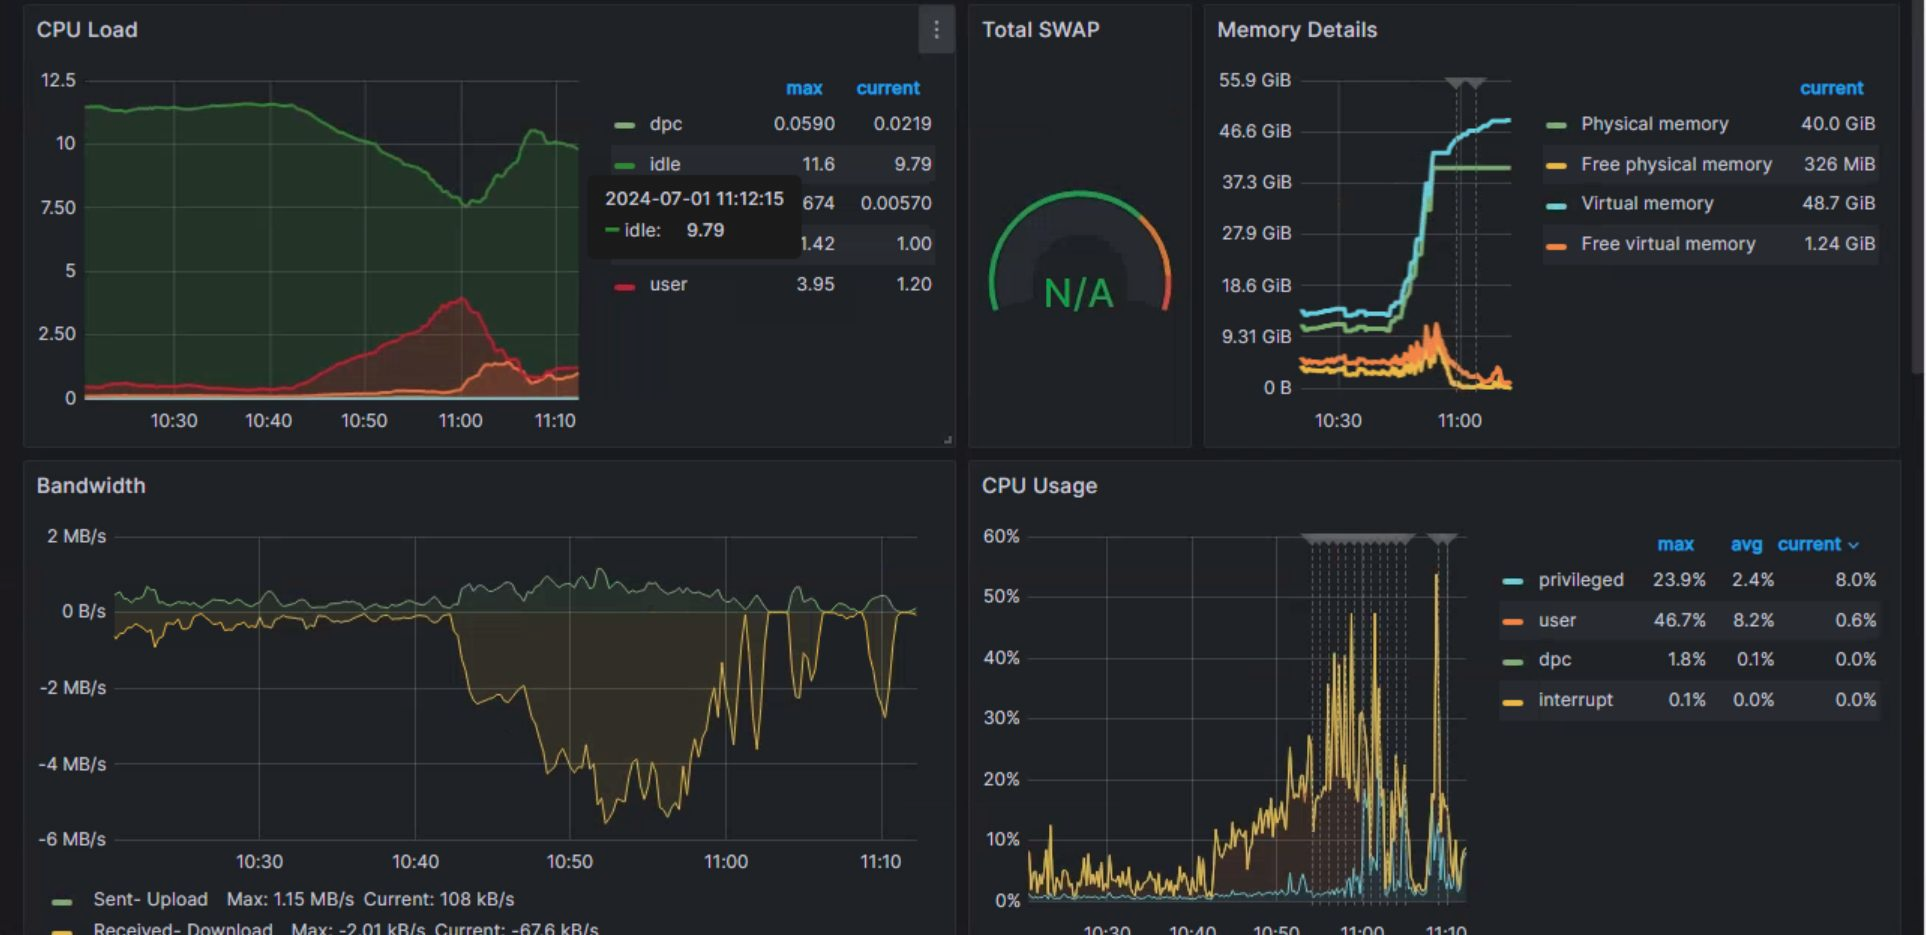
For memory, we can see the visualisation in the top right representing the memory details, we can see that some time around ~10:40AM the utilisation of our memory began to grow exponentially, quickly reaching a point where we hit our memory limit and the process was inevitably killed.
We now have the resource and roughly the time that the issue began, lets look further into our portal services logs to see if we can identify the requests that occurred around 10:40AM.
Looking through the Elasticsearch instance that aggregates logs for the portal service I have found that we have a grouping of request logs to our API that matches the timing for our crash beginning:
2024-08-03 10:41:00 192.168.1.1 GET /api/GetObjectsFiltered - 443 [USER] [IP ADDRESS] Mozilla/5.0+(Windows+NT+10.0;+Win64;+x64;+rv:90.0)+Gecko/20100101+Firefox/90.0 500 12 0 17000 -

2024-08-03 10:41:01 192.168.1.1 GET /api/GetObjectsFiltered - 443 [USER] [IP ADDRESS] Mozilla/5.0+(Windows+NT+10.0;+Win64;+x64;+rv:90.0)+Gecko/20100101+Firefox/90.0 500 12 0 19000 -

2024-08-03 10:41:01 192.168.1.1 GET /api/GetObjectsFiltered - 443 [USER] [IP ADDRESS] Mozilla/5.0+(Windows+NT+10.0;+Win64;+x64;+rv:90.0)+Gecko/20100101+Firefox/90.0 500 12 0 15060 -

2024-08-03 10:41:02 192.168.1.1 GET /api/GetObjectsFiltered - 443 [USER] [IP ADDRESS] Mozilla/5.0+(Windows+NT+10.0;+Win64;+x64;+rv:90.0)+Gecko/20100101+Firefox/90.0 500 12 0 14600 -

...
All originating from the same user, having long latency and the quantity bytes sent indication being undefined ('-').
Scoping the requests to the user in Elasticsearch, I have found that requests are originating from a control that is used to map items in the backend together so that they can be referenced later by analysts.
Following the API route back through the code for the control within in the portal service, the control which calls this route does so via a search bar, this search bar has a debounce feature to delay the search request being automatically initiated by 800 milliseconds, meaning that the search will initiate 800 milliseconds after the last key press, which is fine if you type quickly, but if you take >800 milliseconds to press a key, a search request is going to fire.
Example debounce in JavaScript:
function debounce(func, timeout = 300){
  let timer;
  return (...args) => {
    clearTimeout(timer);
    timer = setTimeout(() => { func.apply(this, args); }, timeout);
  };
}
function saveInput(){
  console.log('Saving data');
}
const processChange = debounce(() => saveInput());
But ~5 requests aren't going to do that much harm? This is where we recall the amount of tickets in the database, unfortunately the control was scoped to automatically search the base class, meaning that each search query is hitting every table in the database which would be 100's of GB of data.
So given an example of a slow typist, searching for an ID of a ticket to map to another ticket would look like this:
Request 1: 1 = 200GB
Request 2: 12 = 120GB
Request 3: 123 = 30GB
Request 4: 1234 = 500MB
Request 5: 12345 = 40MB
Request 6: 123456 = 12MB
The Solution
The solution for this issue luckily is easily implemented: increase the debounce timer to something larger than 800 milliseconds, doing so quickly and drastically cut the rate of memory pressure crashed immediately, and improved user's experience with the service.
Conclusion
When we encounter issues with a system, the USE (Utilization, Saturation, Errors) and RED (Rate, Errors, Duration) methods offer frameworks to identify root causes and mitigate them. By using these frameworks, we can enhance system reliability, optimise performance, and ensure a smoother operational experience.