Telegraf and Grafana for Real-time Modbus monitoring
Introduction:
In my post here: link, I outlined with an application which I wrote, how we can read data from Modbus devices, and store them at a high frequency into InfluxDB for visualisation and alerting. In this post, were going to be taking a look at Telegraf, and how we can use it for real-time metrics visualisation in Grafana.
Introducing Telegraf:
Telegraf is an open source server agent for collecting metrics from many different sources including services, databases, IoT sensors and more, there are hundreds of plugins available for Telegraf which can be used to ingest data from almost any data source you can think of, take a look: here
Telegraf not only has the ability to ingest date from many sources, but you can also:
- Process (filtering and transforming)
- Aggregate (average mean, maximum, minimum, etc)
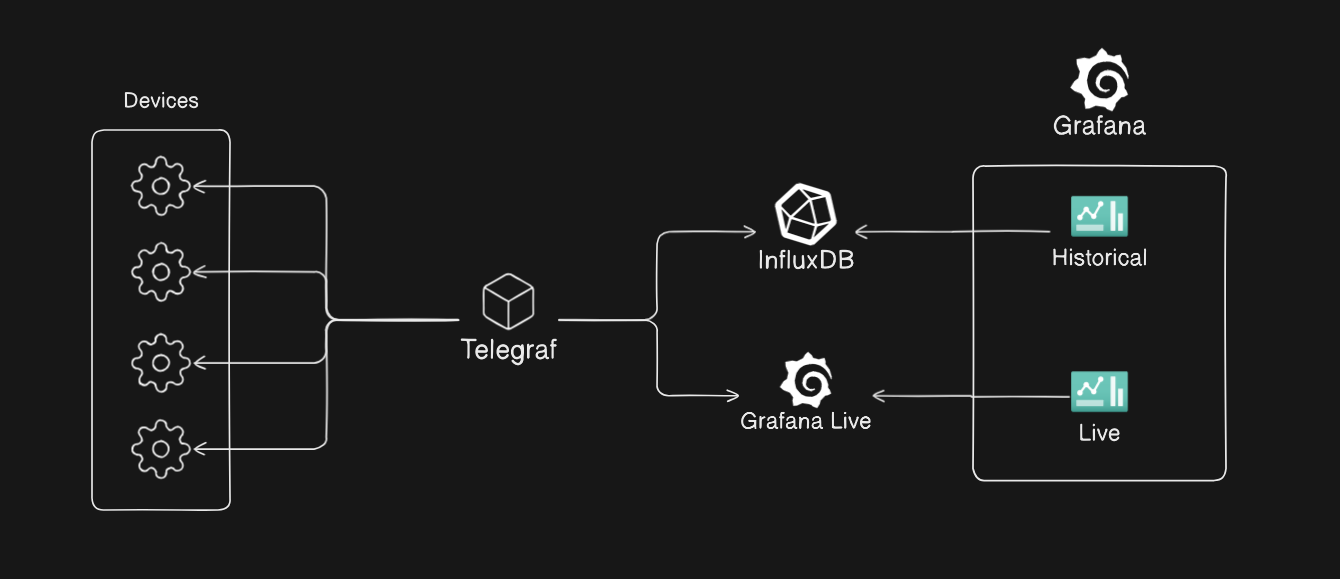
For this post, we will be using Telegraf to poll our Modbus device, and to send our metrics via WebSocket to Grafana.
Real-time Example:

Components:
For building this real-time Modbus example, we'll be using the following components:
- Telegraf
- Modbus mock server
- Grafana with Grafana Live
Grafana Live:
In Grafana v8.0, the real-time messaging engine Grafana Live was introduced, this engine allows you to push event data to a frontend as soon as the event occurs, of course the real-time isn't perfect real-time as there is the opportunity for network latency, etc for causing a delay in messages reaching the frontend.
Putting it together:
You can find the GitHub repo for this example at: link
Telegraf
We will use the following toml file for our Telegraf config:
[[inputs.modbus]]
  name = "Mock Modbus"
  slave_id = 1
  interval = "50ms"
  timeout = "250ms"
  controller = "tcp://modbus-server:1503"
  configuration_type = "register"

  holding_registers = [
    { name = "hr0", byte_order = "AB", data_type = "FIXED", scale=1.0, address = [0]},
    { name = "hr1", byte_order = "AB", data_type = "FIXED", scale=1.0, address = [1]},
    { name = "hr10", byte_order = "AB", data_type = "FIXED", scale=1.0, address = [10]},
  ]

[[outputs.influxdb_v2]]
  urls = ["http://influxdb:8086"]
  token = "[TOKEN FROM INFLUXDB]"
  organization = "opswire"
  bucket = "modbus"

[[outputs.websocket]]
url = "ws://grafana:3000/api/live/push/ws_modbus_telegraf"
data_format = "influx"
# Add these settings
flush_interval = "25ms"
flush_jitter = "10ms"
[outputs.websocket.headers]
    Authorization = "Bearer [SERVICE ACCOUNT TOKEN FROM GRAFANA]"
Breaking it down, we declare our Modbus device as input, as well as providing some important settings for our real-time metrics, the most important two for our dashboard being:
interval = "50ms"timeout = "250ms"
interval is the period in which we are polling the Modbus server, every 50ms we are polling each holding register, and we wait only 250ms to timeout any failed attempts should they occur.
We define, as we did in the previous post, our holding registers, which are configured to return their cardinality as their value, e.g. hr1 = 1, hr10 = 10.
Next, we define our InfluxDB output, this is where we will be storing all of our time series data which I will expand on later.
Finally, we define our WebSocket output, the string ws_modbus_telegraf defines the topic name within Grafana, and again some important settings for exporting the data at the right frequency:
flush_interval = "25ms"flush_jitter = "10ms"
flush_interval is the interval at which Telegraf will clear its buffer, and sends metrics out, where flush_jitter is a random interval that adds a small random delay (up to 10ms) to prevent all metrics from trying to transmit simultaneously.
There are two areas where tokens need to be added:
token = "[TOKEN FROM INFLUXDB]"Authorization = "Bearer [SERVICE ACCOUNT TOKEN FROM GRAFANA]"
For 1:
- Go to
http://localhost:8086and set up InfluxDB - Set up for a Go application and get your token
For 2, do the following:
- Go to
http://localhost:3000 - Create a service account: example here
- Add a service token to that account: example
Grafana
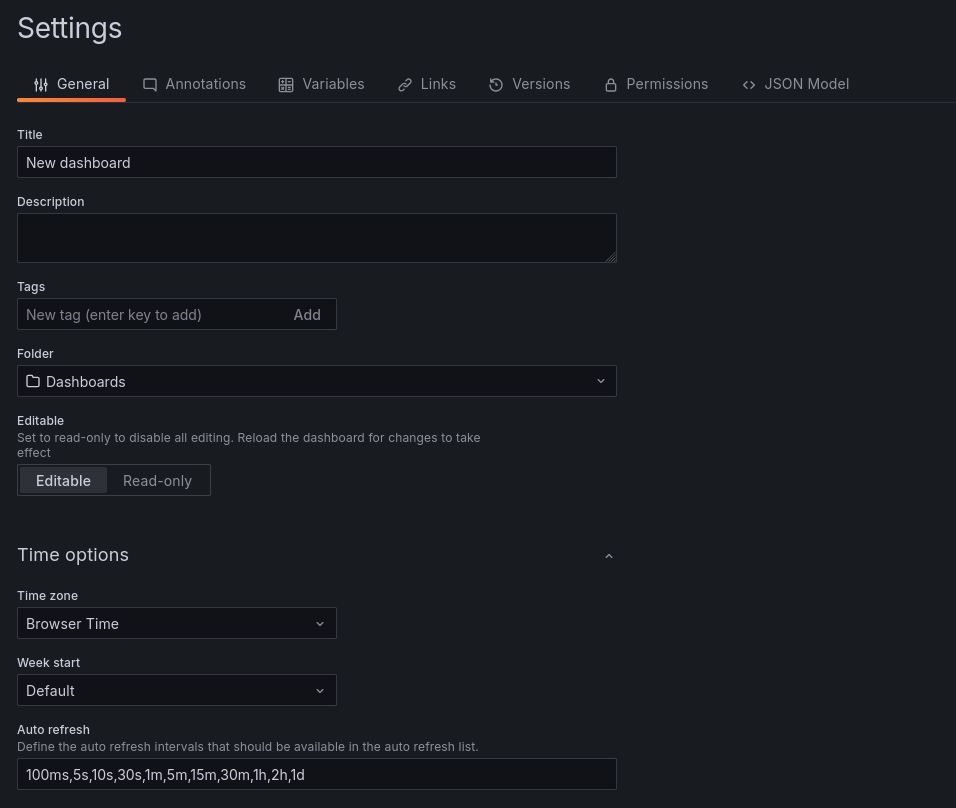
One note to be mentioned about the configuration of Grafana, is modifying the minimum dashboard interval rate, I have set this to 100ms and this can be done by adding the following environment variable to the Grafana container:
GF_DASHBOARDS_MIN_REFRESH_INTERVAL=100msBefore setting up the dashboard in Grafana, make sure that you have generated the above tokens and updated your telegraf.conf, here's how to set up the visualisation using Grafana Live:
- Create a dashboard:

- Add a new visualisation to your dashboard:
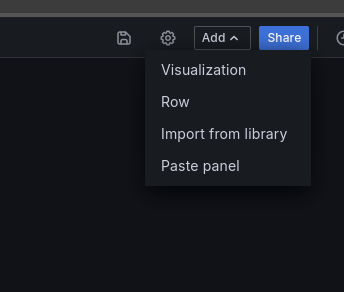
- Make sure the Data source is set to Grafana:
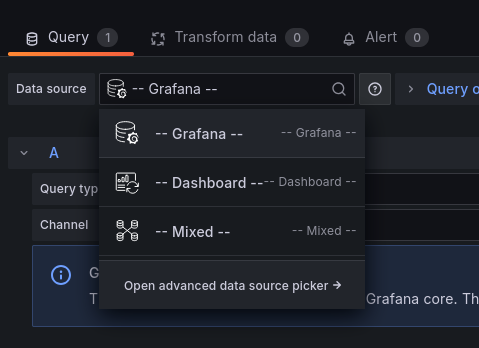
- Change the Query type to Live Measurements:

- Change your channel to the topic which you named in the
telegraf.conf:

- Set your buffer to
10mto allow Grafana to store more data points for visualisation.

- Add the visualisation to your dashboard

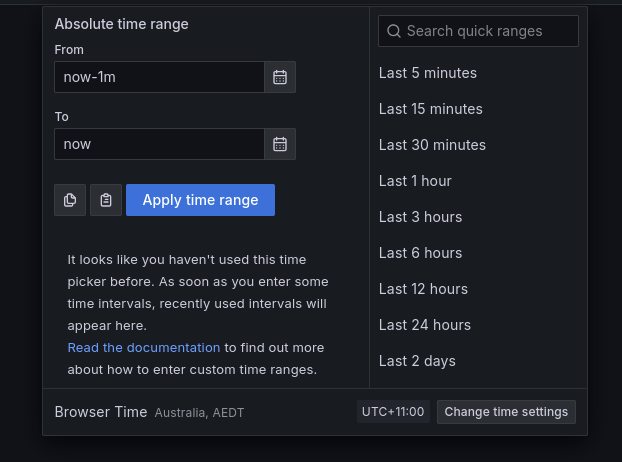
- Change the the time range to
1m:
- Finally, update your update interval to 100ms for a nicer looking refresh rate:
You should end up with a dashboard that looks something like this:

You can also import the dashboard with the visualisation panel already set up from the repo: here
Improving monitoring auditability:
Having a live dashboard displaying the last few minutes of data from our Modbus devices is incredibly useful for real-time monitoring and quick diagnostics. However, the current setup is limited by the short buffer, leaving us blind to any events or trends outside of this time window.
To address this, we have implemented a secondary pipeline in the docker compose file which is to store historical data in InfluxDB. This retain a much longer history of device metrics and system behavior, enabling in-depth analysis of past events, trend identification, and root cause investigations.
With InfluxDB's querying capabilities, we can now perform retrospective analyses to answer critical questions about performance and anomalies, ensuring better visibility into the overall health and operational patterns of our Modbus devices.
At Opswire, I’m building a consultancy dedicated to helping businesses like yours achieve scalable, reliable systems while making observability and automation simple and effective. Whether it’s monitoring Modbus devices, setting up modern CI/CD pipelines, or tackling complex infrastructure challenges, Opswire is here to help.
Thanks so much for reading! If you found this helpful or want to stay updated on future posts about Monitoring, DevOps, and Site reliability, make sure to subscribe to the newsletter.
Let’s keep building better systems together!

