Step-by-step: Building a Scalable Observability Stack

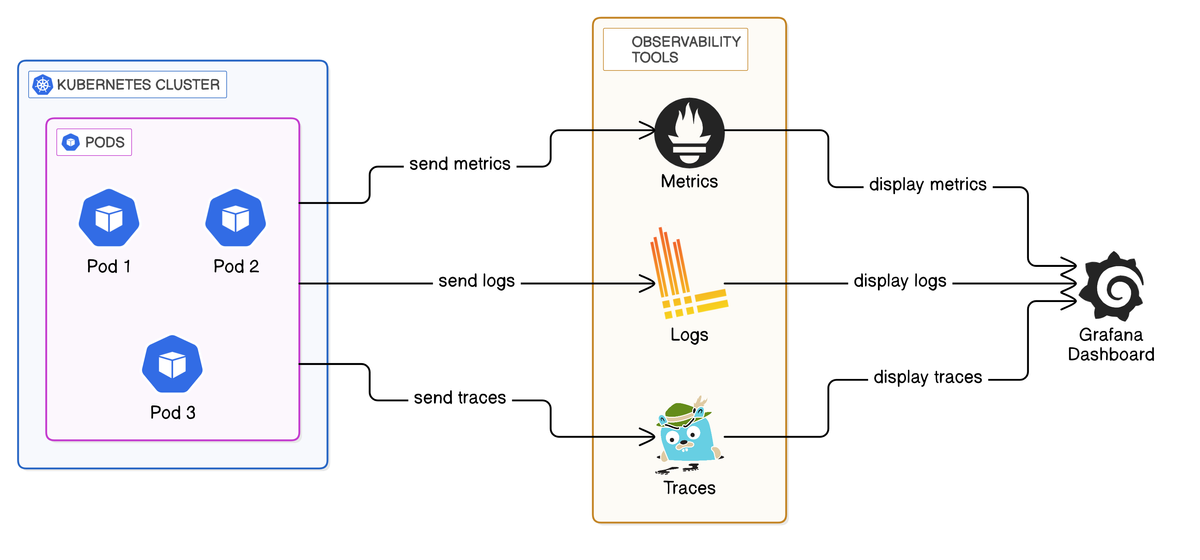
Table of Contents
- Introduction
- What is Observability?
- Key Components
- Benefits of Cloud-native Observability
- Building a Scalable Stack
- Challenges and Best Practices
- Conclusion
- How Opswire Can Help
Introduction:
Observability is crucial for modern applications, it allows teams to save time when debugging issues, provides actionable insights into our systems, and provides a lens with which we can reduce waste and optimise resources. However, maintaining your observability stack while your business grows comes with its own unique challenges including data overload, tool sprawl and scaling your infrastructure. The goal of this article is to provide a practical guide to setting up a scalable observability stack.
Understanding Observability Basics:
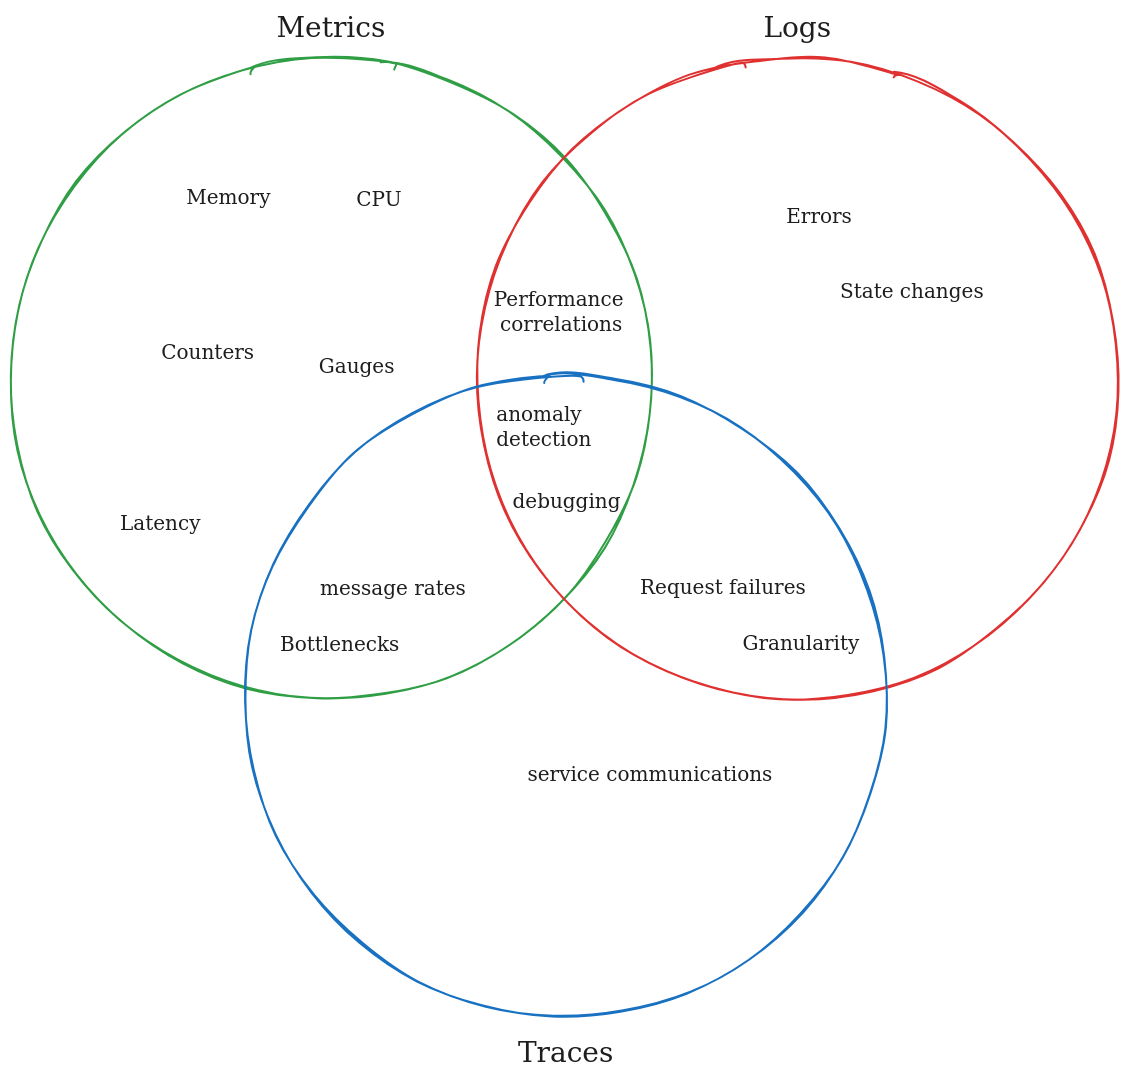
Firstly lets define the basics of Observability, the primary data types of Observability are:
- Metrics: Numeric measurements used to quantify performance or health of a service.
- Logs: Recorded details of events occurring within a service.
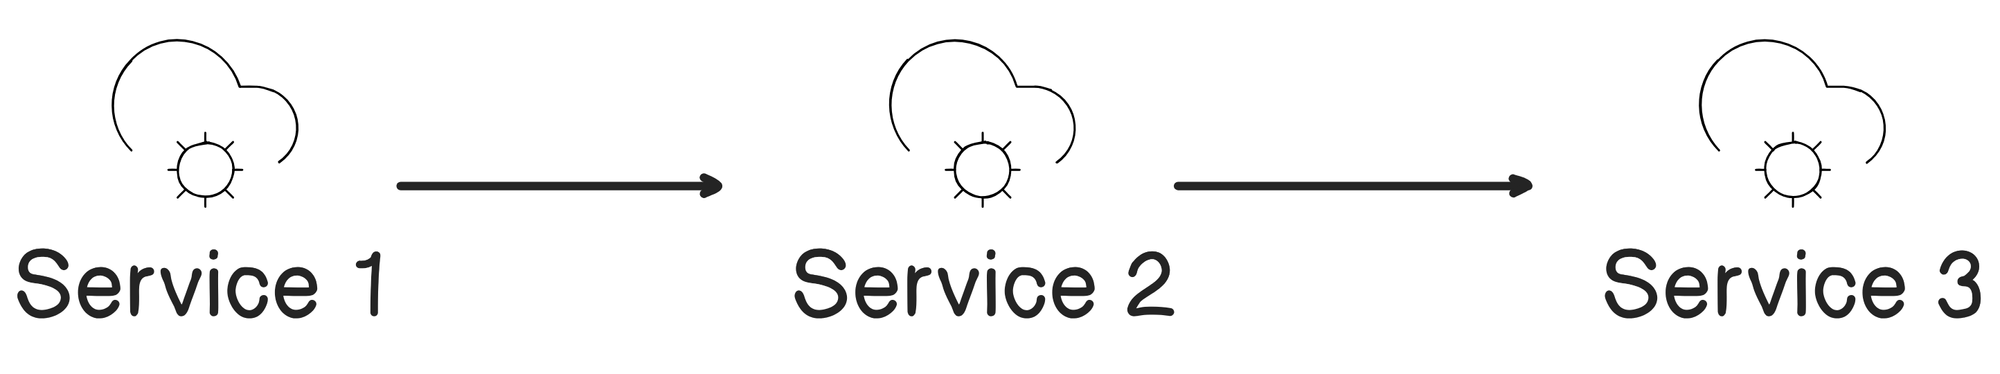
- Traces: Tracks communications between services from end-to-end in response to requests.
Scalability for your observability stack is crucial, as businesses grow, so do their infrastructure, applications and user bases, this leads to increased complexity and data volume having an scalable observability stack ensures, that your business can maintain its visibility, performance and reliability without becoming overwhelmed.
As defined by AWS, the difference between Monitoring and Observability is that monitoring is the process of collecting data about a system to check if the system is operating correctly, Observability incorporates extra situational data including historical data, as well as system integrations. It enables the ability to perform root cause investigations into alerts coming from monitoring systems.
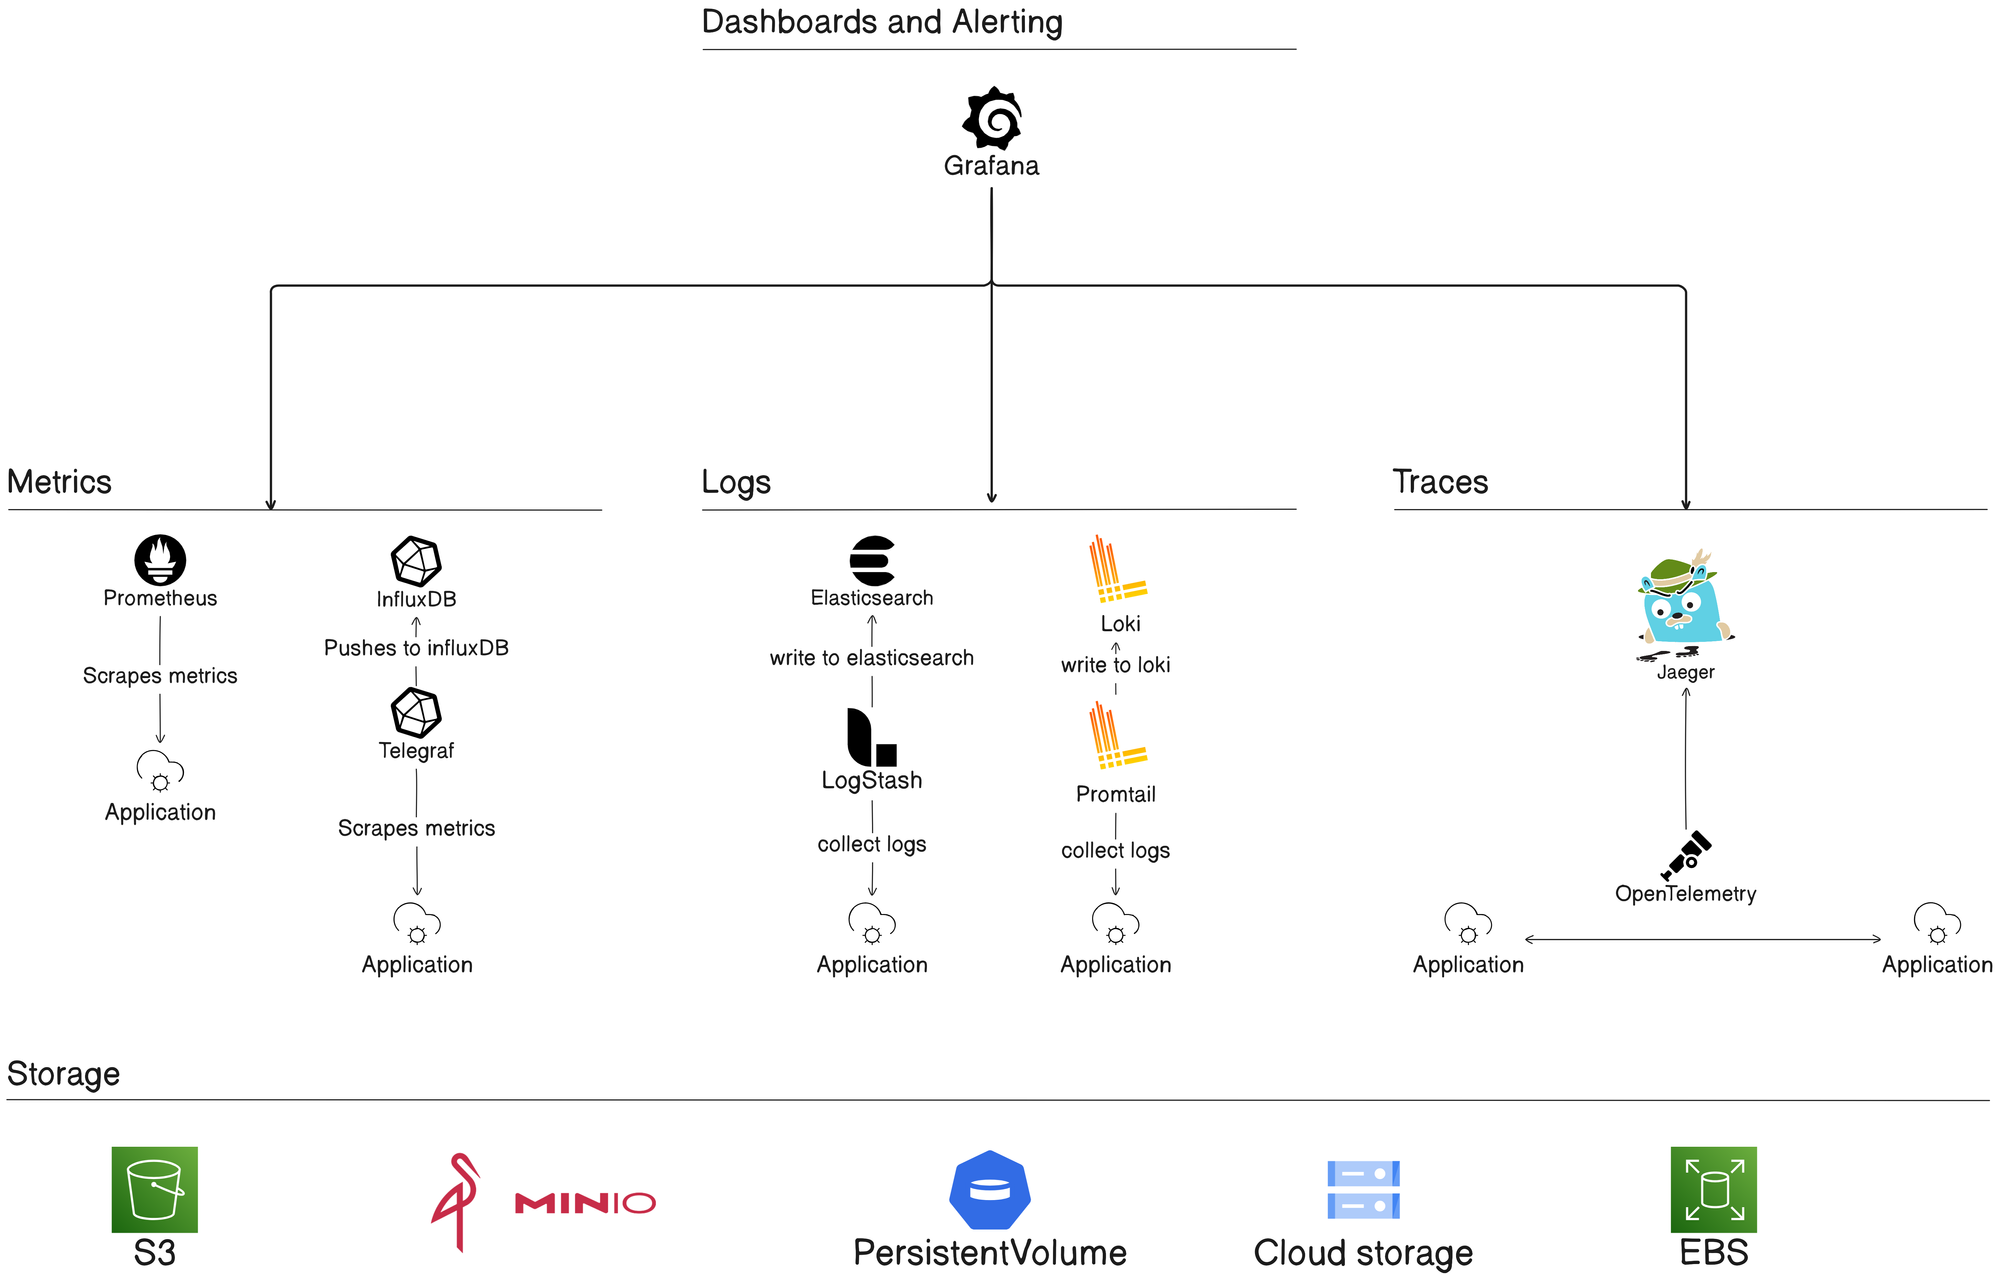
Key Components of a Scalable Observability Stack:
Lets break down some examples of key components of an observability system and how they map to our data types:
- Metrics: OpenTelemetry, Prometheus, InfluxDB
- Logs: OpenTelemetry, Loki, Elasticsearch, LogStash
- Traces: OpenTelemetry, Jaeger
- Dashboards and Alerts: Grafana
- Data Storage: Efficient data storage solutions like object stores or databases.
Architecture Overview:
Benefits of Containerisation and Cloud-native solutions:
Containers are built to encapsulate an application and its dependencies so that it can run in many different environments. In terms of scalability, containers can easily be replicated to scale up an application, orchestration tools like Kubernetes allow the automation and management of containerised applications, including automated scaling. Cloud-native solutions are designed to be portable across different cloud platforms, allowing for flexibility in choosing environments without being locked in to a provider.
For our observability stack, those specific features are important, to allow for our system to be scalable, we should choose solutions which are containerised and cloud-native, explicitly so that we can horizontally scale up and down the observability resources depending on demand.
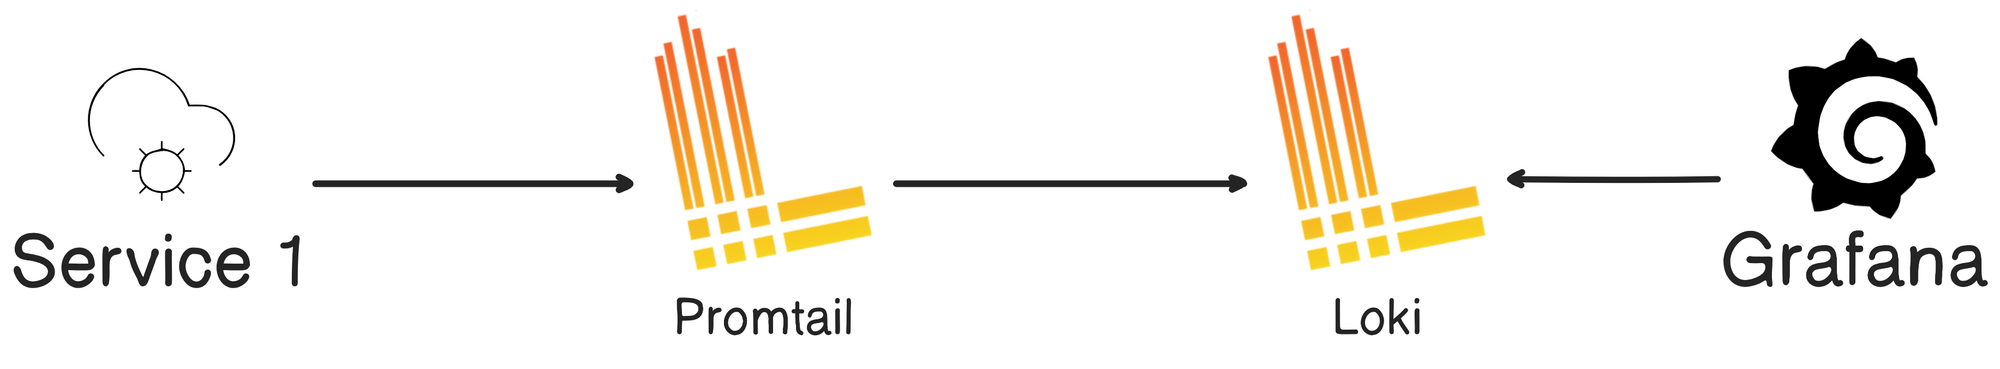
Lets look at an example where we may require scaling our observability resources up and down depending on load, assume you have a web application which you are monitoring, you are retrieving the metrics with Prometheus, logs with Loki and Promtail, and are visualising and alerting with Grafana.
There is a new product launching on your web application, this is going to cause an increase in the volume of logs, metrics and traces.
Prometheus:
- While traffic spikes, Prometheus may need to be able to scrape more frequently, or from additional services.
- Auto-scaling allows Prometheus to scale up to handle the increased number of time-series data without losing data.
Loki and Promtail:
- As traffic increases, logs will increase exponentially, without auto-scaling, Loki may not be able to handle the logs which are being ingested, this could lead to the dropping of logs, or unresponsive dashboards.
- Auto-scaling Loki ensures that it can scale horizontally to handle the increased log ingestion.
Grafana:
- As more users are using Grafana for visualisations during the traffic peaks, scaling Grafana can ensure that dashboards remain low latency and responsiveness.
Setting Up the Stack:
The following are instructions for deploying a scalable observability stack to a Kubernetes cluster:
Metrics:
Installing Prometheus Operator using Helm:
- Add the Helm Chart repository:
helm repo add prometheus-community https://prometheus-community.github.io/helm-charts
helm repo update
- Create a namespace for monitoring:
kubectl create namespace monitoring- Install the Prometheus Operator Helm Chart:
helm install prometheus-operator prometheus-community/kube-prometheus-stack --namespace monitoringProvide Storage for Prometheus:
- Specify a PersistentVolumeClaim (PVC):
prometheus:
  prometheusSpec:
    storageSpec:
      volumeClaimTemplate:
        spec:
          accessModes: ["ReadWriteOnce"]
          resources:
            requests:
storage: 50Gi- Apply the updated config:
helm upgrade prometheus-operator prometheus-community/kube-prometheus-stack --namespace monitoring -f values.yaml
Horizontal Scalability with Thanos:
Thanos would be an article on its own, so I will briefly cover it here, and give a high level overview for how Thanos allows us to horizontally scale Prometheus.
Thanos is an open-source project that builds on Prometheus to provide long-term storage, horizontal scalability and high availability.
- Add a Thanos Sidecar to each Prometheus instance, this has two roles:
- Upload metrics to long term object storage
- Expose data to other Thanos components using gRPC
- Deploy a Thanos store gateway, this allows:
- Querying data directly from long-term storage
- Reduces reliance on Prometheus for the historic data
- Deploy a Thanos query, this acts as the query aggregator and is query-able from Grafana, and provides us with a single query endpoint for our metrics.
Configuring Scrape
Lets assume that a team has built a Go application, with the Prometheus client library or with the OpenTelemetry Prometheus exporter, heres an example with the Prometheus client library:
package main

import (
    "github.com/prometheus/client_golang/prometheus/promhttp"
    "net/http"
)

func main() {
    http.Handle("/metrics", promhttp.Handler())
    http.ListenAndServe(":8080", nil)
}
When we deploy this application to our cluster with the Prometheus Operator deployed, we can add the following annotations to provide service discovery for Prometheus:
metadata:
  annotations:
    prometheus.io/scrape: "true"
    prometheus.io/path: "/metrics"
    prometheus.io/port: "8080"
Deploy a ServiceMonitor CRD to the cluster:
apiVersion: monitoring.coreos.com/v1
kind: ServiceMonitor
metadata:
  name: my-app
  namespace: monitoring
spec:
  selector:
    matchLabels:
      app: my-app
  endpoints:
    - port: http
      path: /metrics
      interval: 30s
- The
selectormatches Kubernetes services with specific labels (e.g.,app: my-app). - The
endpointsspecify the metrics path, port, and scraping interval.
Once the above is setup, your application deployments will automatically be scraped by the Prometheus instance.
Logs:
We have two options:
- Deploy Loki with Helm
- Deploy the Loki Operator
The Loki Operator, allows us to deploy a LokiStack which is a deployment of Loki within Kubernetes. The Helm deployment is similar in features.
Best practices with Loki
- Use promtail as a sidecar with your applications and direct them towards your LokiStack service or your Loki service.
- Deploy Loki in a highly available setup so that you don't loose metrics if one instance fails.
- Use object storage for scalable and cost-effective storage.
Traces:
- Deploy Jaeger with the Jaeger Operator or with Helm
- Instrument your application with OpenTelemetry and use the
go.opentelemetry.io/otel/exporters/jaegerlibrary
package main

import (
	"context"
	"fmt"
	"log"
	"net/http"

	"go.opentelemetry.io/otel"
	"go.opentelemetry.io/otel/exporters/jaeger"
	"go.opentelemetry.io/otel/sdk/resource"
	"go.opentelemetry.io/otel/sdk/trace"
	semconv "go.opentelemetry.io/otel/semconv/v1.20.0"
	"go.opentelemetry.io/contrib/instrumentation/net/http/otelhttp"
)

func main() {
	// Set up OpenTelemetry Tracer with Jaeger
	shutdown := setupTracer()
	defer shutdown()

	tracer := otel.Tracer("example-service")

	http.Handle("/hello", otelhttp.NewHandler(http.HandlerFunc(func(w http.ResponseWriter, r *http.Request) {
		ctx := r.Context()
		_, span := tracer.Start(ctx, "HelloHandler")
		defer span.End()

		// Simulate some work
		span.AddEvent("Doing some work")
		w.WriteHeader(http.StatusOK)
		fmt.Fprintln(w, "Hello, Jaeger!")
	}), "HelloEndpoint"))

	// Start the server
	log.Println("Listening on :8080")
	if err := http.ListenAndServe(":8080", nil); err != nil {
		log.Fatalf("Failed to start server: %v", err)
	}
}

// setupTracer configures the Jaeger exporter and returns a shutdown function.
func setupTracer() func() {
	// Create a Jaeger exporter
	exporter, err := jaeger.New(jaeger.WithCollectorEndpoint(
		jaeger.WithEndpoint("http://localhost:14268/api/traces"),
	))
	if err != nil {
		log.Fatalf("Failed to create Jaeger exporter: %v", err)
	}

	// Create a TracerProvider
	tp := trace.NewTracerProvider(
		trace.WithBatcher(exporter),
		trace.WithResource(resource.NewWithAttributes(
			semconv.SchemaURL,
			semconv.ServiceName("example-service"),
			semconv.ServiceVersion("1.0.0"),
			semconv.DeploymentEnvironment("development"),
		)),
	)

	// Register the TracerProvider as the global one
	otel.SetTracerProvider(tp)

	return func() {
		_ = tp.Shutdown(context.Background())
	}
}
Example Jaeger trace collector
Challenges and Solutions:
Handling high cardinality in metrics:
High cardinality refers to metrics which have a large number of unique label combinations, which will cause excessive resource consumption, slow queries and potentially causing system instability. Here are some examples of ways to handle high cardinality metrics:
- Understand your sources:
- Analyse metrics labels and identify the dimensions with high variability, like
user_id,session_id, etc.
- Analyse metrics labels and identify the dimensions with high variability, like
- Aggregate, replace highly variable labels with aggregated labels:
- Instead of
user_iduseuser_group, etc.
- Instead of
- Try sampling your metrics, instead of getting all data points for high cardinality metrics, use tools like OpenTelemetry that can control sampling rates for traces and metrics.
Balancing log retention vs cost:
Balancing your log retention vs the cost to store the logs is a common challenge in observability, here are some quick tips to help figure out how much is needed:
- Understand your retention requirements:
- Determine what the logs are needed for, real-time monitoring? Debugging? Compliance?
- Check legal requirements like GDPR, etc.
- Categorise your logs into different levels of importance and specify retention per category:
- Critical: longer retention
- Non-critical: shorter retention
- Debug: discarded after immediate use
- Implement Tiered storage:
- Make use of cloud providers different levels of storage classes for different log categories, this can allow you to immediately make savings on logs which you don't need at hand all the time.
Conclusion:
Building a scalable observability stack is a critical step ensuring the performance and reliability of your systems as they grow. By leveraging cloud-native and containerised solutions, you can maintain visibility and control without becoming overwhelmed by the complexities of modern architectures.
Tools like Prometheus, Loki, Jaeger, and Grafana provide a solid foundation for monitoring, logging, and tracing, while scaling mechanisms such as auto-scaling, efficient storage solutions, and best practices for handling high cardinality ensure that your stack remains robust and cost-effective.
Opswire specializes in building resilient, scalable, and high-performance systems tailored to your business needs.
To explore how Opswire can elevate your observability strategy and overall system resilience, contact us today. Our team is ready to provide tailored solutions that align with your organisation's specific needs.