Monitoring Sydney Transport with GTFS, Prometheus, and Grafana


Introduction
In this post, I will outline the process of building a GTFS-Realtime Prometheus exporter for monitoring and visualising the Sydney transit system with Grafana. Additionally, I will provide details about working with the GTFS API alongside Prometheus and Grafana.
Check out the live Grafana dashboard here: link
Overview
Building a comprehensive monitoring system for the Sydney transit system involves several key components:
- GTFS-Realtime API: Fetching real-time transit data.
- Prometheus: Storing and querying the transit data.
- Grafana: Visualizing the transit data.
We'll go through each of these components step-by-step, culminating in a powerful dashboard to monitor the Sydney transit system in real-time.
Motivation
The 2024 Grafana Golden Grot award was given to Ruben Fernandez for his daily commute dashboard. You can check it out here. Inspired by this, and leveraging my experience in developing monitoring systems with Grafana and Prometheus, along with a growing interest in GTFS, I decided to build my own monitoring system for the overall transit system. This project aims to provide a clear and comprehensive view of Sydney's transit operations, helping to identify and address issues promptly.
Why is it valuable to monitor the Sydney transit system with Prometheus and Grafana?
For me, this was primarily an experiment in learning how to build a monitoring system for a large non-software system.
Monitoring the Sydney transit system provides a better insight into how the system is functioning, from a user's point of view it could help you better understand what times are best to travel or for example, if you are waiting longer than usual for your regular train you could gain insight from seeing that there may be fewer trains than normal running.
Prometheus is well known and well utilised for building monitoring and observability systems, and the development tools built around it make it very easy to do so. In conjunction with Grafana, we can build a very simple, very powerful monitoring system.
Background:
GTFS:
GTFS is an open standard used for distributing relevant transit system information to users, it provides public transit agencies with a way to publish their data in an established format using Protocol Buffers, GTFS is currently used by thousands of transport providers.
GTFS Realtime contains important live details about transport, which includes:
- Trip updates
- Vehicle Positions
- Service Alerts
Prometheus:
Prometheus is a time-series database that follows a pull model, meaning that on the initialisation of the Prometheus instance, you provide a list of targets which are scraped automatically, and the metrics are stored in the time-series database with the time they were scraped. At time of writing according to 6sense, Prometheus is used by 7528 companies worldwide: source.
Grafana:
Grafana is an open source analytics and interactive visualisation web application, in conjunction with Prometheus is provides us the ability to query and visualise the data gathered by Prometheus, it also allows us to alert over the web based on certain rules. It is widely used for monitoring applications and system performance, its users include Bloomberg, JP Morgan Chase, eBay, etc.
Setup and Requirements:
Design Overview:
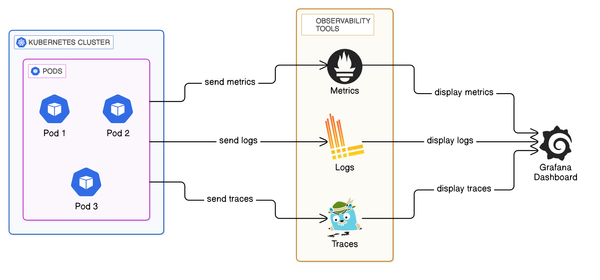
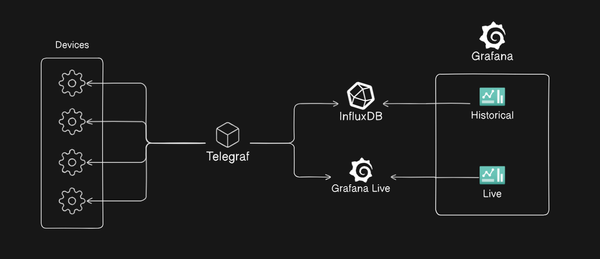
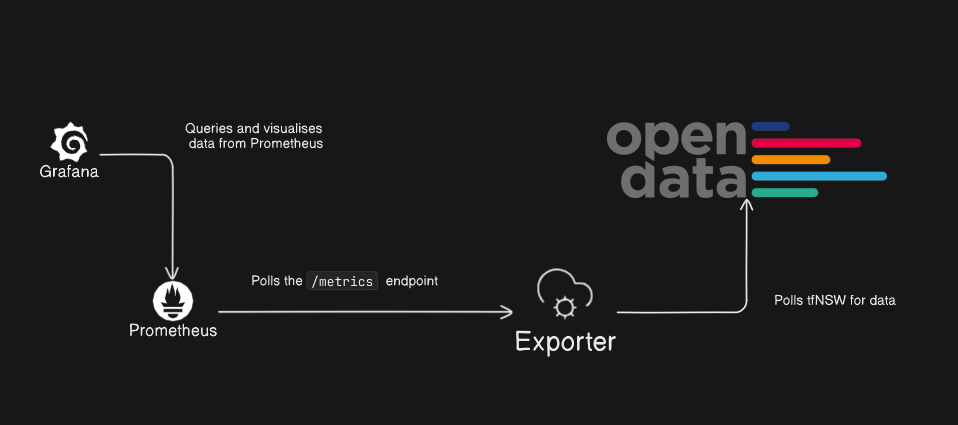
I decided to use a standard design for monitoring the system which is composed of the following parts:
- A Prometheus exporter
- Prometheus
- Grafana
An example of this is:
Building the GTFS Prometheus Exporter:
Understanding the GTFS API:
The GTFS API responds in a binary format, which you cannot read without the .proto file which defines the format.
Each method of transport has its own distinct API endpoint which returns in the same format as the .proto file.
To use the TfNSW Open Data API endpoint for GTFS you will need to:
- Create an account with TfNSW
- Request an API key
- Download the
.protofile - Use a tool like protoc to convert the proto file into code in your chosen programming language
- Make the API calls in your code.
Prometheus Exporter:
As there is no existing Prometheus exporter, I wrote my own in Go: Github repo,
An overview of what it does is:
- Polls the Open Data Realtime API Endpoint for GTFS Realtime
- Updates Metric Types (Counters, Gauges, etc.)
- Exposes those metrics in the Prometheus format to be scraped by Prometheus
Metrics Selection:
The metrics that I went with were intended to align with the USE Method, which is a Systems Engineering methodology for solving performance issues and bottlenecks quickly, created by Brendan Gregg.
Therefore the selection of metrics I went with are:
- Count of Trains
- Count of Buses
- Count of Ferries
- Count of Metro
- Count of Light Rail
- Occupancy
Counts:
Counts represents the current reporting transport methods within the API feed, for example: 1370 Bus Count corresponds with 1370 buses currently actively reporting their position and stats.
Occupancy:
Occupancy is a reported statistic from the various methods, each vehicle reports its current occupancy statistic and this ranges from Empty to Full, this is used by the transit system for showing the occupancy of each carriage, for trains this is calculated from the weight of the carriages: source
Conclusion:
Future Improvements:
Some future improvements are:
- Live vehicle location display in the dashboard
- Incorporation of Operational performance, Headway adherence, Travel time, Route coverage.
By integrating the GTFS-Realtime API with Prometheus and Grafana, we can create a robust monitoring system for the Sydney transit system. This project provided me with valuable insights into real-time transit operations but also showcases the power of combining these technologies for effective data visualisation and monitoring.
If you have any requests for improvements or features, you can add them as an issue to the GitHub repo: https://github.com/azaurus1/gtfs-sydney-exporter
Appendix:
- Github Repo: https://github.com/azaurus1/gtfs-sydney-exporter
- Docker Hub: https://hub.docker.com/r/azaurus/gtfs-sydney-exporter
- Public Dashboard: https://grafana.azaurus.dev/public-dashboards/91d420da1a1e4ce9899de7d22fbc214e
- Tutorial for instrumenting a Go application with Prometheus: https://prometheus.io/docs/guides/go-application/