Monitoring Modbus via Prometheus and Grafana


📢 Important Announcement
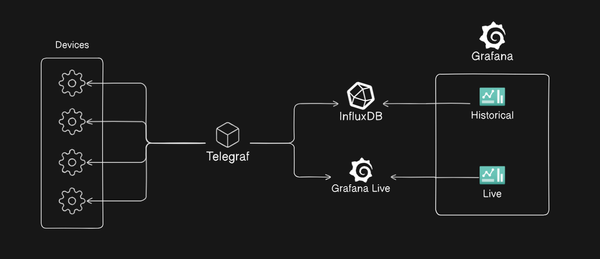
The following article is about first retrieving Modbus data from devices with a Teltonika 4G router. If you are not too concerned about latency of the data from the devices, this article is fine. However, if you are concerned with latency and would like a solution that works at milliseconds, check out: this guide on InfluxDB for Modbus observability.
Overview:
In this blog post, I will be outlining the decisions and challenges faced during the process of bringing modern observability practices to the problem of monitoring the status of remote radio sites.
Objectives:
The following are the objectives and expected outcomes of doing so:
- A robust and highly available modern observability system that provides near real time latency.
- Data persistence for auditing purposes
- All provided via 4G due to the remoteness of the radio sites.
Importance of monitoring remote sites:
When I say the radio sites are remote, I mean that for anyone to access them to maintain, monitor or upgrade the hardware running at the site, a helicopter is required, making costs sky rocket unnecessarily.
Understanding the Technologies:
4G IoT Routers:
Despite the remoteness, the locations of the radio sites (on top of hills and mountains) are very close to existing mobile network cell sites (also on top of hills and mountains luckily), this provides us the opportunity to leverage this existing network with a 4G IoT router.
In this case, the 4G IoT router that we'll be using is the Teltonika RUT240, which comes shipped with Teltonika Network's own OpenWrt based operating system, which implements many ways to collect and forward data from our remote sites, making the job a lot easier.
Overview of Modbus:
Modbus is an industrial protocol developed in the late 1970s to provide communication between automation devices. More recently, Modbus has been upgraded to include implementations over TCP/IP aswell as serial and UDP.
A brief overview is that Modbus is:
- A request-response protocol
- One device acts as a master (responsible for initiating interactions)
- One device acts as a slave (usually a sensor, a programmable logic controller, etc.)
In our case, we will be using modbus to monitor the various analog variables such as battery voltage, solar panel power output, switches which can be triggered through various means, and we'll be doing this with an ioLogik E2242 from Moxa, which is a universal controller that has 4 analog inputs (which we can use to monitor our battery voltage, etc.) and 12 digital input-outputs (which we will use for our switches, essentially a boolean).
Intro to Prometheus and Grafana:
Prometheus and Grafana are both open-source tools, widely used for monitoring and alerting on infrastructure.
Prometheus:
Prometheus is a time-series database that follows a pull model, meaning that on the initialisation of the Prometheus instance, you provide a list of targets which are scraped automatically, and the metrics are stored in the time-series database with the time they were scraped. At time of writing according to 6sense, Prometheus is used by 7528 companies worldwide: source.
Grafana:
Grafana is an open source analytics and interactive visualisation web application, in conjunction with Prometheus is provides us the ability to query and visualise the data gathered by Prometheus, it also allows us to alert over the web based on certain rules. It is widely used for monitoring applications and system performance, its users include Bloomberg, JP Morgan Chase, eBay, etc.
System Architecture:
High level architecture diagram:
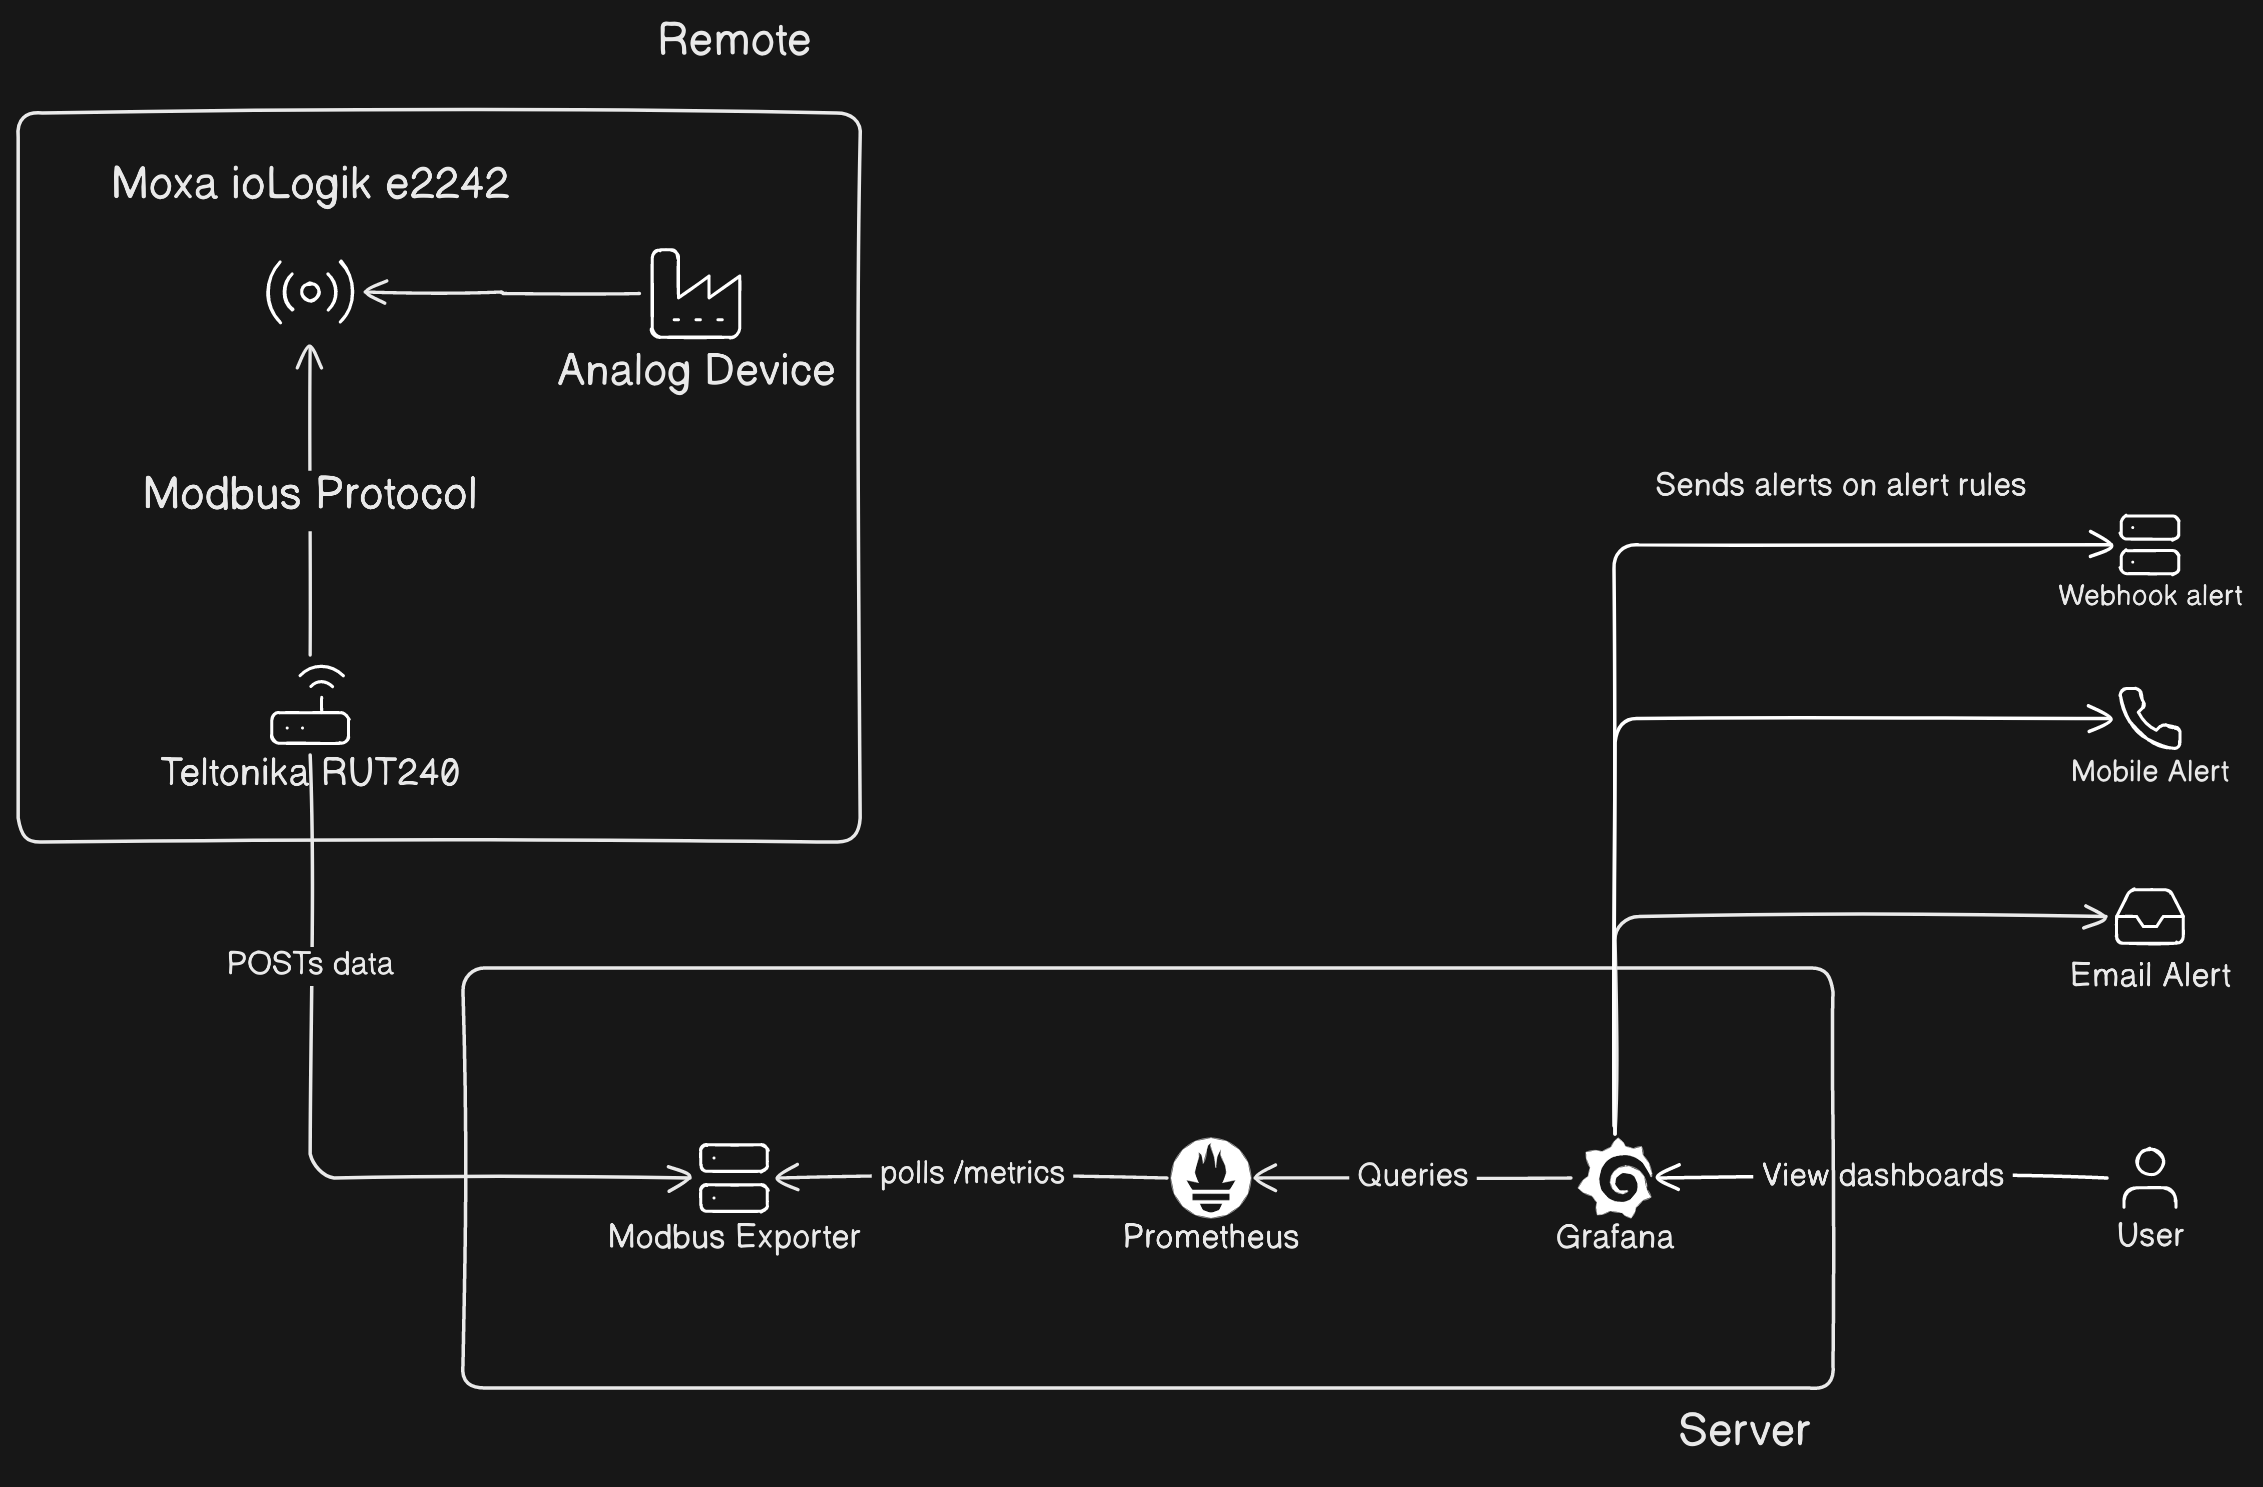
Integration points and data flow:
Each components role:
Analog Device:
Our analog device that we are wanting to monitor the status of at the remote location, whats being monitored here is:
- Voltage
- Current
- Switches
Moxa ioLogik e2242:
The universal controller, which is connected physically to our analog device, with the voltage and current which we are monitoring connected to the Analog Input (AI) channels and the switches which are being monitored are connected to the digital input (DI) channels. This is also our Modbus 'server', which allows us to make those values available via the Modbus protocol.
Teltonika RUT240:
Communicates via Modbus with the Moxa ioLogik collects data and sends it via HTTP to the Modbus exporter.
Modbus Exporter:
An HTTP server written in Go, which receives data sent from the Teltonika, stores it in memory, and makes it available in the format that Prometheus expects it on the /mertics route.
Prometheus:
Polls the /metrics route on the Modbus exporter, reads the values returned, and stores it in the time-series database against the time which it was retrieved.
Grafana:
Queries the data stored in the Prometheus database, and allows users to visualise the data in dashboards and provides the ability to send alerts via many channels (email, phone call, etc.) when metrics reach certain thresholds.
Data flow:
- Data flows from the analog device to the Moxa ioLogik e2242, being captured via its data acquisition capabilities.
- The Moxa ioLogik e2242 sends this data to the Teltonika RUT240 using the Modbus protocol.
- The Teltonika RUT240 posts this data to the Modbus Exporter in a suitable format for Prometheus to scrape.
- Prometheus periodically polls the Modbus Exporter to retrieve the latest metrics.
- Users can then query Prometheus from Grafana to visualise the data on dashboards.
- If certain conditions are met (as defined by alert rules in Prometheus or Grafana), alerts are triggered and sent out through the appropriate channels: webhook, mobile, and email.
Developing the Prometheus Exporter:
Challenges and requirements:
The main challenge for developing the Modbus Prometheus Exporter was the fact that we could not gather information from the Teltonika directly via a GET request, and that we would need to receive data on a schedule via POST requests coming from the Teltonika, this posed 2 issues:
- Inadvertently displaying data when the Teltonika is not sending data correctly, giving the impression that the system is functioning correctly when it is not.
- Possible delays over 4G
To overcome these issues, it was important to provide some buffer time of about 20% in case of any delays in the 4G network, and when this time span is breached, the Exporter will set a health flag to false, this indicates that either:
- The Teltonika is down completely, or
- That there has been a delay in sending the data from the site.
We can then use this value to invalidate any data on the /metrics route, and also use this to send alerts on the health of the data being sent from the site.
Key functionalities and features:
Exporter:
- Very easy to deploy and configure
- Provides ability to invalidate data on missed data.
Go:
- Speed, Go is known for powerful performance
- Internet Friendly, Go is used extensively for Web development
- Fast Garbage collection.
- Easy to maintain.
- Easy to learn.