Introduction to OpenTelemetry for Startups

Measure what is measurable, and make measurable what is not so - Galileo Galilei
Startups are notorious for moving fast. Rapid iteration, scaling and user satisfaction is all dependent on keeping your systems reliable. OpenTelemetry (OTel), is an open-source framework for metrics, logs and traces, which can be used to make the sometimes overwhelming task of implementing observability easy.
Why Startups Need Observability?
- Fast Debugging: don't waste unnecessary time debugging issues.
- User Insights: gather actionable insights.
- Cost Efficiency: reduce waste and optimise your resources.
A well designed observability system saves time, reduces overall downtime and ensures that your team can focus on building rather than fighting fires.
What is OpenTelemetry?
OpenTelemetry or OTel, is the universal translator for your observability system. Its features include:
- Open-source: Free, community-driven and widely supported
- Vendor-neutral: Don't get locked-in to using any one vendor, use OpenTelemetry with various tools like Grafana, Prometheus, Datadog and many more.
- Comprehensive: Collect every metric type from your applications, traces, metrics and logs.
- Developer friendly: OpenTelemetry is designed to easily instrument your applications in many languages.
What makes OpenTelemetry perfect for Startups:
- Budget-friendly: OTel is free, and easily integrates with existing stacks
- Flexible: Start small and expand as you grow
- Actionable Insight: Get real-time visibility into bottlenecks and errors.
Use Cases:
Debugging and troubleshooting:
Imagine you have an API which is running slowly. With OTel's distributed tracing, you can easily track and pinpoint the bottleneck; a database query, which you can fix in minutes instead of spending hours manually tracing through logs back to the source. This level of insight is really priceless for growing startups.
Ensure Reliability:
Your users are complaining about slow load times for certain important functions of your application like loading their personal profile, you can easily setup Service Level Indicators (SLIs) and Service Level Objectives (SLOs) to ensure the reliability of the services responsible with data you collect with OpenTelemetry.
Getting Started (Quick Steps):
Below is a basic roadmap which you can use to implement OpenTelemetry in your application:
- Set up instrumentation: Add the OpenTelemetry SDK to your application.
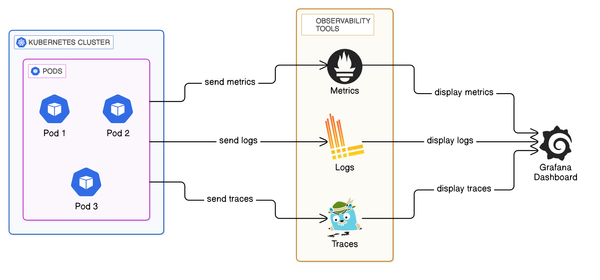
- Configure exporters: Decide where you would want to send your data, and utilise its exporter, these could be Prometheus, Grafana, Datadog, etc.
- Visualise your data: Set up dashboards to monitor key metric, logs and traces.
- Alert: Set up alerts for certain metrics which you feel you would need to be notified for, for example: a process using a certain threshold of memory, etc.
- Iterate: Use the insights you gain from your dashboards and alerts to improve your application.
Quick tips:
- Start small: identify critical paths for your users (Critical user journeys) and focus on instrumenting them first, examples of these could be user login, or checkouts.
- Set realistic goals: SLIs and SLOs don't need to be perfect; start with rough estimates and iterate.
- Monitor your costs: Exporting to managed platforms can incur extra costs.
Final thoughts:
OpenTelemetry provides startups the ability to move quickly and stay reliable without spending a fortune and being locked into a vendor. If you haven't given OTel a try yet, there is no better time to start than now.
Try OpenTelemetry today and level up your observability game. Check out the OpenTelemetry Docs to get started.
If you are looking for expert help in setting up your observability stack, Opswire offers tailored services to integrate OpenTelemetry into your stack and maximise your system's reliability.
Have you already used OpenTelemetry in your startup? I’d love to hear about your experiences share your insights in the comments or connect with me directly!


