InfluxDB for Modbus Observability

Introduction
In this previous blog post, I demonstrated a small application I made to retrieve Modbus metrics from a Teltonika Wi-Fi router which would collect metrics and send them via REST, this system works fine if you are happy with a lag in your metrics of up to a second or 2 depending on network conditions, due to:
- The
modbus-http-exporterwaiting for the metrics that are sent via REST. - Prometheus pulling metrics from the exporter.
So, what can we do if we want to have millisecond delays instead?
Pull vs Push model
Firstly, we need to understand the differences between push and pull models for metric collection.
Pull model:

The Pull model does exactly as the name implies, it is a monitoring methodology which actively retrieves metrics from a list of targets. Each target for the pull method requires to expose the necessary metrics in a standardised format.
Pros of pulling metrics:
- You can create extra monitoring resources when needed.
- You can easily tell when a target resource is down.
- Health of a target can be manually checked via a web browser.
- Centralised configuration.
Cons of pulling metrics:
- You require a service discovery method, e.g. you have to be able to provide each location of the targets.
- Each target must be reachable from the monitoring system.
- HTTP can timeout, especially on larger metric exporters.
- You introduce more of a delay to the actual metrics, as you must wait for the monitoring system to tick over to pull the metrics on schedule.
Push model:

The Push model, works by immediately sending metrics once they have been gathered, eliminating the delay of waiting for the monitoring system to scrape the application for metrics.
Pros of pushing metrics:
- No delay of waiting on pulling scrape cycles.
- Updates are real-time.
- Flexible configuration for network settings like NAT or firewalls.
Cons of pushing metrics:
- No knowledge of targets, there is no way for the monitoring system to know whether a target is supposed to be sending metrics or not.
- Potential for bottlenecks if the monitoring system cannot handle the number of pushes
- If a network partition occurs between monitoring and application/devices, there's no built-in way to know.
How can we use push metrics for Modbus?
Assuming we want very low latency metrics coming from our modbus devices, and also assuming that your network has been configured to allow for very low latency traffic, what can we do?
As mentioned in the pros for the push model, we can get updates in real-time by utilising the push model, therefore we need to look into what monitoring systems support the push model, some of the options are below:
- InfluxDB
- Prometheus via PushGateway (Not recommended)
- TimescaleDB
- VictoriaMetrics
There are many options for push-based monitoring systems however for this blog post I will be taking a look at InfluxDB.
InfluxDB
InfluxDB is a time-series database, which can be used to collect data up to nanosecond precision. InfluxDB has been rated #1 time series database by DB-Engines (source: db-engines)
Why InfluxDB for Modbus?
I have chosen InfluxDB for this example for a few main reasons:
- Speed (as mentioned earlier, InfluxDB can be used with upto nanosecond precision)
- InfluxDB can handle high throughput data ingestion.
- Open source, InfluxDB's source code is available on Github here: link
This works for Modbus because it allows us to receive and alert on changes within our Modbus connected devices within milliseconds.
modbus-influxdb demo

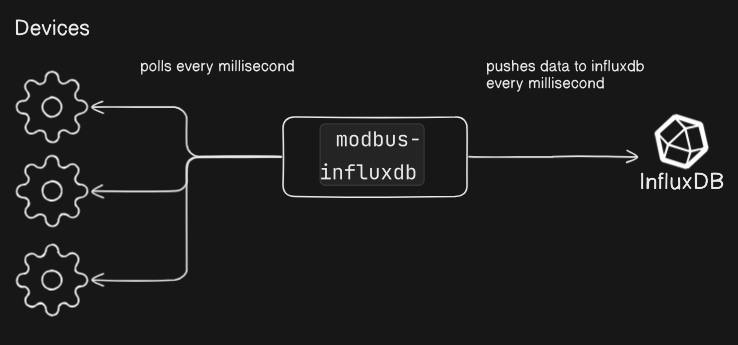
For this post, I have created an example application which scans each connected devices holding register, and immediately pushes the retrieved data to InfluxDB.
Here's a link to the GitHub repo: https://github.com/azaurus1/modbus-influx
Explanation
The modbus-influxdb demo expects an instance of InfluxDB running on the host machine and an instance of a mock Modbus server, both of these are defined in the docker-compose.yml file and can be started with: docker compose up being run in the root directory of the demo.
Detailed steps:
- Run
docker compose upin the root directory - Go to
http://localhost:8086and set up InfluxDB - Set up for a Go application and get your token
- Export your token to the environment with
export INFLUXDB_TOKEN=[Your Token from InfluxDB] - In another terminal run
go run ./cmdin the root folder of the demo
What you will see in the docker compose terminal after running go run ./cmd will be debug logs from the mock modbus server displaying each read call of each holding register every millisecond.
Visualisation in InfluxDB:
To visualise the data which is being generated from the mock modbus server within InfluxDB, you can open the data explorer in InfluxDB and enter the following query script:
from(bucket: "modbus")
|> range(start: v.timeRangeStart, stop: v.timeRangeStop)
|> filter(fn: (r) => r["_measurement"] =~ /^holding_register_\d+$/)
|> aggregateWindow(every: v.windowPeriod, fn: mean, createEmpty: false)
|> yield(name: "mean")
This should show something like this:

Each register is configured in the server.json file to return its index as its value, e.g. Register 10 returns 10 for its value.
Future posts
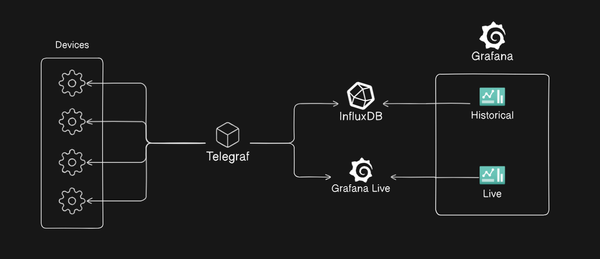
This post is a part of a series around creating sub-second observability systems for IoT devices using Modbus, in future posts I will be going over how to utilise the InfluxDB Collector, Telegraf with Modbus to provide real-time metrics, as well as showing how we can use Redpanda to provide realtime insights from Modbus devices.
Don't forget to subscribe for more tips and tutorials on improving your observability systems.
Thanks for reading!


