Going Mobile: Part 4


3 Parts:
This post will be split into 3 parts:
- Networking
- Monitoring
- Chaos Engineering
Networking:
The networking stack is comprised of 3 main parts:
- MagicDNS with Headscale
- HAProxy
- Traefik
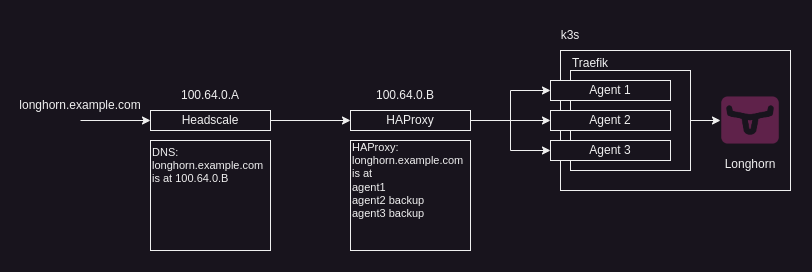
MagicDNS with Headscale
The Headscale server handles the DNS resolution with MagicDNS, an example of how this is implemented in the Headscale config file is below:
  extra_records:
     - name: "longhorn.example.com"
       type: "A"
       value: "100.64.0.B"
The above record will be applied to every tailscale client within the tailnet so that any traffic for longhorn.example.com from clients or servers within the tailnet will be routed to 100.64.0.B.
In our case, we use this to direct any our ingress routes we are exposing in the cluster to our HAProxy instance.
source: https://github.com/juanfont/headscale/blob/main/docs/dns-records.md
HAProxy
HAProxy is a free, fast and reliable load balancing / reverse proxy solution that also offers high availability.
In our case, HAProxy is used to route traffic from any client and server in the tailnet to any active and available node in the cluster, the main benefit for us is that we can define one server as a main server for our services, and in the case that it goes down, the backup servers can take up the slack.
An example of the HAProxy config is below:
frontend https-in
    bind *:443 ssl crt /etc/ssl/private/haproxy.pem alpn h2,http/1.1
    mode http

    # ACLs for each service
    acl host_longhorn hdr(host) -i longhorn.example.com

    # Traffic routing based on ACL
    use_backend longhorn_backend if host_longhorn

# Backend for Longhorn
backend longhorn_backend
    mode http
    balance roundrobin
    option httpchk HEAD / HTTP/1.1\r\nHost:longhorn.example.com
    http-request set-header Host %[req.hdr(Host)]
    server agent1 100.64.0.C:80 check
    server agent2 100.64.0.D:80 check backup
    server agent3 100.64.0.E:80 check backup
Example HAProxy config
As we can see in the above example, we are setting each of the agents to a tailnet ip address, these addresses correspond to our k3s agent nodes, and we also repeat the requests header when sending the requests to the nodes with:
http-request set-header Host %[req.hdr(Host)]This allows us to communicate the ingress which we want to use to the Traefik instance running on whichever node that we are routed to.
Traefik
k3s deploys Traefik as an ingress controller, this means that there will be a LoadBalancer service deployed on each of our nodes in the k3s cluster, which we will be able to use to access the ingress controller on ports 80 and 443.
We must then deploy an Ingress to allow the LoadBalancer service to listen for the correct host to route to the services within the cluster:
apiVersion: networking.k8s.io/v1
kind: Ingress
metadata:
  name: longhorn-ing-traefik
  namespace: longhorn-system
  annotations:
    kubernetes.io/ingress.class: traefik
spec:
  rules:
  - host: "longhorn.example.com"
    http:
      paths:
      - path: /
        pathType: Prefix
        backend:
          service:
            name: longhorn-frontend
            port:
              number: 80
Longhorn Ingress Example
Monitoring
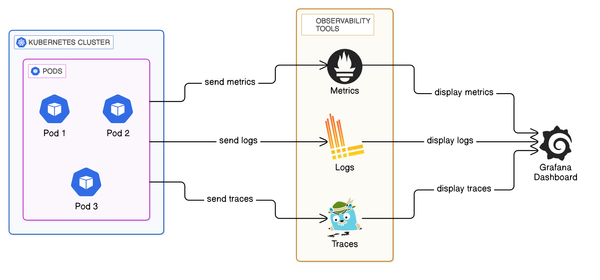
kube-prometheus-stack
I have chosen to use kube-prometheus-stack as my main monitoring deployment, kube-prometheus-stack is a stack of monitoring tools and resources that can be installed on your Kubernetes cluster in a single helm chart, it will automatically deploy node exporters to each node in the cluster to allow you to monitor the status of each of your nodes. The stack includes:
- Kuberentes manifests
- Grafana + Dashboards
- Prometheus + rules
Linkerd
Linkerd is a service mesh (dedicated infrastructure layer for service-to-service communications).
Linkerd deploys a micro-proxy as a sidecar to each pod running within your cluster, while not necessarily primarily used for monitoring Linkerd adds security, observability, and reliability to our cluster.
Linkerd provides a dashboard called viz, that allows us to view the various metrics provided by the Linkerd like:
- Success rate of requests
- RPS (Requests per second)
- Distribution of latency
Healthchecks.io
Healthchecks.io is a service for regularly monitoring running tasks, it uses the Dead man's switch technique, and has the ability to send out notifications to many different services (Email, Gotify, Webhook, etc..)
I will be utilising this, to run a pod on each node that will send a GET request to the url provided by Healthchecks.
In my example, I have already created the checks in Healthchecks and will be adding them into a ConfigMap:
apiVersion: v1
kind: ConfigMap
metadata:
  name: "healthcheck-urls"
data:
  server1: "SERVER1_URL"
  server2: "SERVER2_URL"
  agent1: "AGENT1_URL"
  agent2: "AGENT2_URL"
  agent3: "AGENT3_URL"
healthcheck-urls-configmap.yaml
and then reference them in a Pod:
apiVersion: v1
kind: Pod
metadata:
  name: healthchecks-going-mobile-agent1
spec:
  containers:
  - name: healthcheck-pod
    image: curlimages/curl
    command: ['sh', '-c', 'while true; do curl -X GET $(HEALTHCHECK_URL); sleep 60; done']
    env:
    - name: HEALTHCHECK_URL
      valueFrom:
        configMapKeyRef:
          name: healthcheck-urls
          key: agent1
  nodeName: agent1
  restartPolicy: Never
healthchecks-going-mobile-agent1.yaml
This approach may be better suited to the templating that can be provided with Helm, but for my current needs I am just deploying 5 separate pods with separate manifests.
With these set up, we can now receive notifications through various media about the availability of our individual nodes in our system.
Chaos Engineering
A brief explanation:
Chaos engineering is the practice of identifying failures before they become actual outages, this is done by proactively testing the system with a manner of different stressors, this allows you to identify and fix issues before they present themselves.
Examples of Chaos engineering include:
- Pod/Application failures
- Power Failures
- Networking issues (partitions, delays, corruption)
- Host Failures (Power outage, reboot)
Chaos Mesh:
I have chosen to use Chaos Mesh, because of its ease of deployment and use.
Chaos Mesh is a CNCF incubation project focused on the principles of Chaos engineering, Designed for Kubernetes, it can quickly and easily be deployed into a cluster.
For Going mobile:
The main purpose for designing and building this was to have a self-hosted platform able to resist at least a single node failure and continue to operate, a few examples for Chaos Experiments related to this follow:
Host Shutdown:
For this there is a separate toolkit: Chaosd, we can run:
chaosd attack host shutdownThis essentially runs:
sudo shutdownWhich will shutdown our node we are running Chaosd on, and we will be able to monitor how the overall system operates without that node running.
Network Partition (Loss of connectivity between different parts of the system):
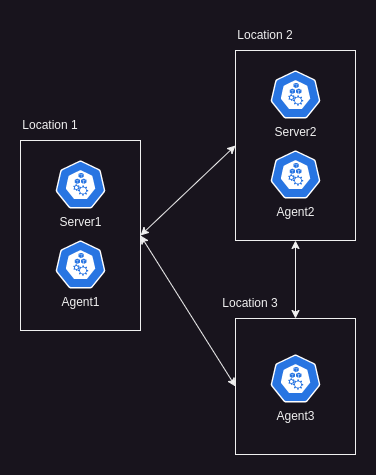
Above is the normal functioning network, all nodes in each location can communicate with each other, below is an example of a network partition at Location 2, where nodes at Location 2 cannot reach the others in the cluster:
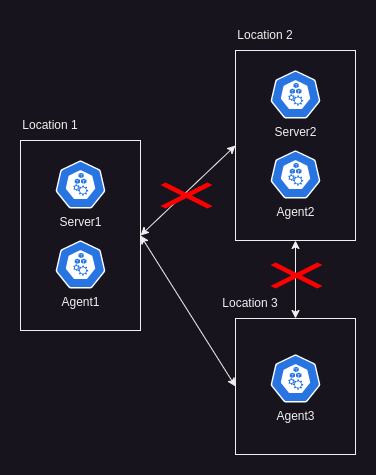
There are various ways to implement the above in Chaos Mesh, however I decided to simulate this using a Chaos workflow and utilised multiple in-series host packet failures of 100% of the following connections:
- Server 2 to Server 1
- Server 2 to Agent 1
- Server 2 to Agent 3
- Agent 2 to Server 1
- Agent 2 to Agent 1
- Agent 2 to Agent 3
Essentially cutting the communications to and from Location 2 completely.
Wrapping it up:
Reflecting on this comprehensive project, it's evident that the networking component was the most enlightening and challenging aspect. The integration of MagicDNS with Headscale, HAProxy, and Traefik presented a complex yet rewarding task, teaching valuable lessons in DNS resolution, load balancing, and routing traffic effectively within a Kubernetes environment.
Overall, the journey from concept to this point near completion was as enlightening as it was challenging. The blend of networking, monitoring, and chaos engineering not only fortified the system's resilience but also expanded my technical expertise. This project serves as a testament to the power of integrating diverse technologies and methodologies to build a system that is not just functional but also resilient and efficient.
Explore the series:
This post is part of the 'Going Mobile' series. Explore the series further:
- Going Mobile: Part 1 - Introduction to the series
- Going Mobile: Part 2 - The design.
- Going Mobile: Part 3 - Understanding a change in the scope.
- You are here: Going Mobile: Part 4 - Going further into Networking, Monitoring and Chaos engineering
- Next: Going Mobile: Part 5 - Covering some troubleshooting, wrapping it up, and the future.